Dielectric Temperature Spectrum Testing for Ceramics
Technical News
Dielectric temperature spectroscopy—evaluating complex relative permittivity (εr′) and dielectric dissipation factor (tan δ) as a function of temperature across multiple decades of excitation frequency—serves as the primary characterization window into solid-state phase transitions, domain relaxation dynamics, and point-defect migration in functional electroceramics. In ferroelectric perovskites (such as BaTiO3, PZT, and relaxor PMN-PT) and microwave dielectrics, tracking dielectric temperature spectra illuminates critical structural phenomena, including the ferroelectric-to-paraelectric Curie transition, morphotropic phase boundary (MPB) stability, and grain boundary defect conduction.
However, executing high-temperature dielectric spectroscopy up to 1000°C exposes measurement data to severe experimental artifacts. Thermally stimulated oxygen vacancy migration introduces massive DC leakage current that creates artificial low-frequency loss upturns; electrode metals oxidize, delaminate, or volatilize above 600°C; and anisotropic thermal expansion loosens contact pressure, generating parasitic air gaps. Resolving true material responses requires rigorous thermal metrology conforming to international standards.
Solid-State Physics of Thermal Dielectric Phase Transitions and Defect Conduction
In ferroelectric ceramics, unit-cell structural transitions generate pronounced anomalies in the dielectric temperature spectrum. In the paraelectric phase above the Curie temperature (TC), dielectric permittivity obeys the classical Curie-Weiss law:
εr′ = CCW / (T − T0) (for T > TC)
where CCW is the Curie-Weiss constant (typically 10⁴ to 10⁵ K in displacive ferroelectrics) and T0 is the Curie-Weiss temperature (T0 ≤ TC). In relaxor ferroelectrics exhibiting diffuse phase transitions (e.g., Pb(Mg1/3Nb2/3)O3), polar nanodomains (PNRs) introduce strong frequency dispersion, and the dielectric peak follows the modified Curie-Weiss relation:
1 / εr′ − 1 / εm′ = (T − Tm)γ / (2 · εm′ · δA²)
where εm′ is the maximum permittivity at temperature Tm, δA characterizes transition diffuseness, and γ is the degree of relaxation (γ = 1 represents an ideal normal ferroelectric, while γ = 2 corresponds to a complete relaxor).
At elevated temperatures (T > 400°C), oxygen vacancies (VO••)—the dominant mobile point defect in perovskite oxides—undergo thermally activated hopping conduction. The DC electrical conductivity σdc(T) follows an Arrhenius relationship:
σdc(T) = (σ0 / T) · exp[−Ehop / (kB · T)]
where Ehop is the migration activation energy (typically 0.8 to 1.2 eV for oxygen vacancies in titanates). Under alternating electric field excitation, this long-range DC conduction superimposes an apparent loss factor that scales inversely with frequency:
tan δapparent = tan δintrinsic + σdc / (ω · ε0 · εr′)
At frequencies below 1 kHz and temperatures exceeding 600°C, σdc / (ω · ε0 · εr′) dominates the spectrum, producing a steep exponential upturn in tan δ that completely masks high-temperature dielectric loss peaks. Decoupling intrinsic dipolar relaxation from DC conduction requires complex impedance (Z*) or electric modulus (M*) formalism:
M* = 1 / ε* = M′ + j · M″ = j · ω · ε0 · Z*
In the electric modulus representation, long-range DC conduction contributes zero to M″ at ω → 0, effectively suppressing the conductive tail and revealing high-temperature relaxation processes.
High-Temperature Electrode Metallization Selection Matrix
The choice of electrode material determines the maximum operational temperature limit and chemical stability of dielectric testing. Unsuitable electrodes can oxidize into insulating metal oxides, form low-melting eutectics, or diffuse rapidly into the ceramic bulk.
The comparative selection table below benchmarks high-temperature conductive electrode pastes:
| Metallization System | Deposition / Sintering Temp (°C) | Maximum Safe Testing Temp (°C) | Chemical Stability in Air & Oxygen | Thermal Expansion Match (α × 10⁻⁶ /K) | Typical Measurement Limitations |
|---|---|---|---|---|---|
| Colloidal Silver (Ag) Paste | 500–600 | 600–650 | Subject to electrochemical migration under DC bias; vaporizes above 700°C | ~19.5 (High mismatch to ceramics) | Temperature ceiling strictly limited to 650°C |
| Organometallic Gold (Au) Resinate | 750–850 | 850–900 | Chemically inert in air; excellent specular contact layer | ~14.2 (Moderate match) | Prone to agglomeration and pinhole dewetting above 900°C |
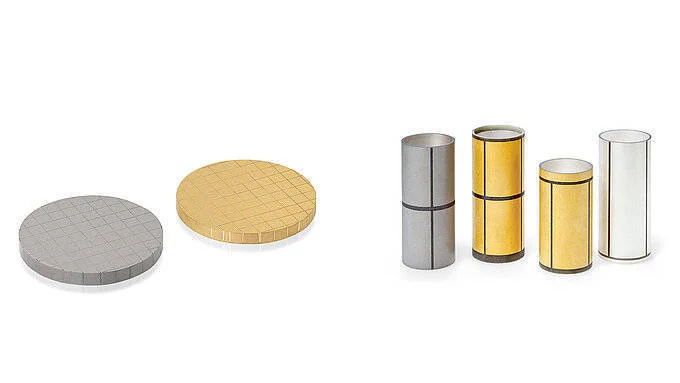
| Pure Platinum (Pt) Paste | 950–1100 | 1000–1600 | Completely non-reactive; zero oxidation; zero volatilization | ~9.0 (Exceptional match to Al2O3 and titanates) | Requires high sintering temperature to achieve low sheet resistance |
| Sputtered Platinum / Titanium | 200–400 (Sputter) | 800–900 | Excellent atomic contact; Ti adhesion layer oxidizes at >600°C | ~9.0 | Thin film (<300 nm) can suffer micro-cracking under thermal cycling |
International Standards and High-Temperature SOP Protocols
Dielectric temperature spectroscopy must be conducted according to standardized testing protocols defined by ASTM D150 and IEC 60250.
Critical procedural requirements include:
- Controlled Heating / Cooling Rates: Testing must utilize moderate thermal ramps (1°C/min to 3°C/min under closed-loop PID control). Rapid thermal heating (>5°C/min) creates non-uniform temperature profiles across the sample thickness, shifting apparent Curie temperatures (TC) and inducing thermal hysteresis between heating and cooling runs.
- Atmosphere Purging and Moisture Desorption: During initial heating from room temperature, physisorbed water molecules inside porous ceramic grain boundaries desorb between 80°C and 130°C. This desorption creates an artificial loss peak and dielectric constant drift. Sintered coupons must be held at 150°C under dry nitrogen or vacuum purge for 30 minutes to establish an anhydrous baseline before acquiring full-spectrum data.
- Electrode Edge Margin: Electrodes must terminate 0.5 mm to 1.0 mm inside the outer perimeter of the ceramic disc to prevent high-temperature surface flashover and suppress lateral fringing electric fields.
The table below outlines common dielectric temperature spectroscopy anomalies and their diagnosis:
| Observed Phenomenon | Physical Mechanism | Temperature / Frequency Domain | Corrective Action |
|---|---|---|---|
| Permittivity Peak at ~100°C | Moisture desorption from pores | 80°C to 120°C (low frequencies) | Pre-dry samples at 150°C in vacuum before testing |
| Large Heating-Cooling TC Shift | Thermal lag across thick specimen | Apparent TC higher during heating | Reduce ramp rate to 1°C/min; reduce sample thickness |
| Permittivity Roll-Off at >1 MHz | Lead wire series inductance (Llead) | High frequencies near resonance | Perform open/short fixture compensation at sample stage |
| Exponential Loss Upturn at >500°C | Oxygen vacancy hopping conduction | High temperatures (f < 10 kHz) | Convert data to Electric Modulus (M″) or Cole-Cole plots |
High-Temperature Dielectric Metrology with the MatMeas DMS-1000 System
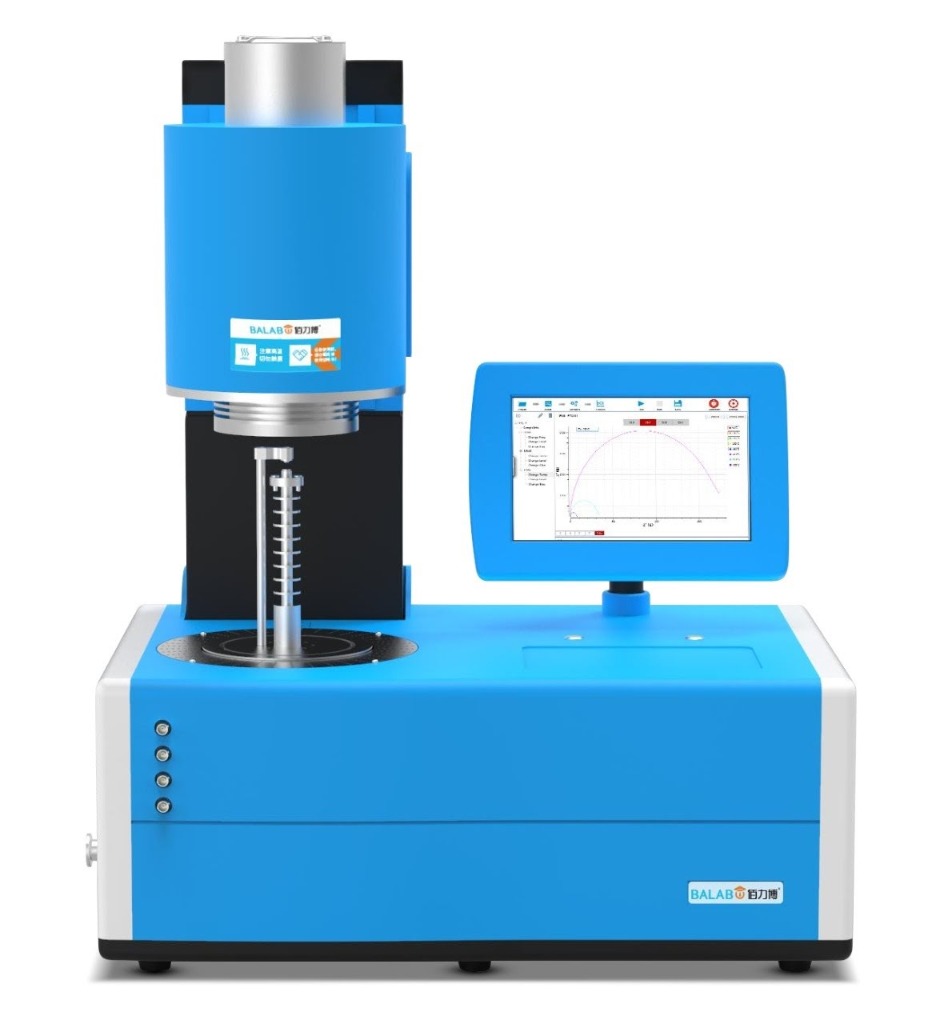
To resolve complex phase transitions and high-temperature dielectric spectra without instrumentation artifacts, the MatMeas DMS-1000 High Temperature Dielectric Spectrometer provides an integrated metrology solution engineered specifically for functional electroceramics.
Operating across a broad temperature span from ambient up to 1000°C, the DMS-1000 utilizes an ultra-pure recrystallized alumina sample holder equipped with spring-loaded platinum electrodes. This mechanical assembly continuously compensates for specimen thermal expansion, maintaining constant contact force across 1000°C thermal cycles without warping fragile ceramic discs. An integrated triaxial guard circuit shunts electrical furnace heater noise and parasitic tube leakage directly to ground, allowing measurement of ultra-low dissipation factors (tan δ down to 1 × 10⁻⁴) from 10 μHz to 30 MHz. Automated software coordinates frequency sweeps at discrete isothermal steps or during linear ramps, automatically plotting Curie-Weiss fittings and extracting activation energies.
Frequently Asked Questions
Why does dielectric loss (tan δ) increase exponentially at temperatures above 500°C?
At elevated temperatures, intrinsic lattice defects—predominantly doubly ionized oxygen vacancies (VO••) in oxide ceramics—gain sufficient thermal energy to overcome hopping activation barriers. This mobile charge carrier flux generates high DC electrical conductivity (σdc). Because measured dielectric loss contains an ohmic term defined by tan δconduction = σdc / (ω · ε0 · εr′), this conductivity drives an exponential increase in measured loss at low frequencies. This behavior represents extrinsic charge conduction rather than intrinsic unit-cell dipolar relaxation.
What is the advantage of using Platinum paste over Silver paste for dielectric testing?
Colloidal silver paste is limited to maximum operating temperatures of 600°C to 650°C. Above 700°C, metallic silver oxidizes, volatilizes, and diffuses rapidly into perovskite crystal lattices, causing sample contamination and short-circuiting. Pure platinum paste is chemically inert in air up to 1600°C, exhibits zero volatilization, and has a coefficient of thermal expansion (~9 × 10⁻⁶ /K) that closely matches alumina and titanate ceramics, preventing electrode spalling during thermal cycling.
How does the electric modulus formalism help analyze high-temperature dielectric data?
The electric modulus M* is the reciprocal of complex relative permittivity (M* = 1 / ε* = M′ + j · M″). In standard permittivity representations (ε″), DC leakage conductivity dominates at low frequencies, creating an enormous conductive tail that obscures dielectric relaxation peaks. In the imaginary modulus M″ representation, long-range DC conduction approaches zero as frequency decreases, suppressing the conductive upturn and clearly revealing high-temperature defect relaxation peaks and interfacial space-charge dynamics.
Request High-Precision Testing Solutions
Get expert guidance and customized instruments for your functional materials project.