Ionic Conductivity Testing of Glass by Impedance Spectroscopy
Technical News
Solid-state glass electrolytes, amorphous ion conductors, and functional glass-ceramics are central to the development of next-generation all-solid-state lithium and sodium batteries, hermetic electro-optic seals, high-reliability nuclear waste vitrification matrices, and chemical sensors. Unlike crystalline ceramic conductors that possess periodic translation symmetry, inorganic glasses exhibit a disordered, topologically random network (such as silicate, borate, phosphate, or thio-phosphate frameworks) interspersed with network-modifying mobile alkali or alkaline-earth cations (e.g., Li+, Na+, K+, Ag+).
Characterizing ion dynamics in disordered glasses requires isolating intrinsic bulk hopping conduction from extrinsic artifacts, including space-charge interfacial barriers, grain-boundary-like phase separation, electrode polarization, and electronic leakage. Electrochemical Impedance Spectroscopy (EIS), conducted across broad frequency (sub-hertz to tens of megahertz) and temperature sweeps, serves as the definitive analytical method to deconvolve these complex electro-transport phenomena.
Microscopic Mechanisms of Ionic Transport in Disordered Glasses
In an oxide or sulfide glass matrix, mobile network-modifying cations reside in localized potential energy wells formed by non-bridging oxygen (NBO) or non-bridging sulfur (NBS) sites. Under thermodynamic equilibrium, ionic transport proceeds via stochastic thermally activated hops between adjacent coordination sites separated by an average jump distance (lambda):
+---------------------------------------------------------------------------------------------------+
|                        Potential Energy Landscape in Glass Ionic Hopping                          |
+---------------------------------------------------------------------------------------------------+
|               /\                  /\                  /\                  /\                      |
|              /  \                /  \   Activation   /  \                /  \                     |
|             /    \   Barrier E_a/    \   Energy     /    \              /    \                    |
|  Site A    /      \  --------->/      \            /      \            /      \                   |
|   (---)   /        \          /        \          /        \          /        \                  |
|    \_/   /          \_/      /          \_/      /          \_/      /          \_/   Site B      |
|    |-----------------|------------------|-------------------|-------------------|                 |
|     Jump Distance lambda                                                                          |
+---------------------------------------------------------------------------------------------------+
The probability per unit time (nu_hop) that a mobile ion hops over the potential energy barrier of height E_a is dictated by the Boltzmann factor:
nu_hop = nu_0 * exp(-E_a / (k_B * T))
Where nu_0 represents the attempt frequency (typically on the order of optical phonon vibrations, 1e12 to 1e13 Hz), k_B is the Boltzmann constant (1.380649e-23 J/K or 8.61733e-5 eV/K), and T is the absolute temperature in Kelvin. Under an externally applied weak electric field (E), the potential barrier is tilted, introducing a net directional drift velocity that establishes the macroscopic DC ionic conductivity (sigma_dc).
The Arrhenius and Meyer-Neldel Formalisms
Over extended temperature intervals below the glass transition temperature (T_g), the ionic conductivity of glass electrolytes conforms strictly to the classical Arrhenius relation:
sigma * T = sigma_0 * exp(-E_a / (k_B * T))
Taking the natural logarithm yields the linear parameterization:
ln(sigma * T) = ln(sigma_0) - (E_a / k_B) * (1 / T)
Where:
- E_a: The macroscopic activation energy for ionic conduction, representing the sum of the electrostatic binding energy required to dissociate the cation from its coordinating non-bridging anion site and the strain energy required to dilate the glass doorway network during migration.
- sigma_0: The pre-exponential factor, which incorporates the mobile carrier concentration (N_c), the jump distance (lambda), the attempt frequency (nu_0), and the migration entropy (Delta S_m):
sigma_0 = (N_c * q^2 * lambda^2 * nu_0 / (6 * k_B)) * exp(Delta S_m / k_B)
In many glass families, an empirical correlation known as the Meyer-Neldel rule (or compensation effect) is observed, where an increase in activation energy E_a across varying compositions is accompanied by a logarithmic increase in the pre-exponential factor:
ln(sigma_0) = ln(sigma_00) + (E_a / E_MN)
Where E_MN is the characteristic Meyer-Neldel energy. Discerning whether variations in conductivity stem from changes in carrier concentration or hopping mobility requires linking conductivity to ion diffusivity via the Nernst-Einstein relation:
D_ion = (k_B * T * sigma_dc) / (N_c * q^2 * H_R)
Here, H_R is the Haven ratio, a correlation factor (typically between 0.3 and 1.0 in glasses) that accounts for non-random, backward-correlated hopping sequences in congested network channels.
Electrochemical Impedance Spectroscopy and Nyquist Arc Deconvolution
Electrochemical Impedance Spectroscopy applies a small sinusoidal voltage perturbation (delta_V(t) = V_0 * sin(omega * t)) across a metallized glass coupon, monitoring the amplitude and phase angle of the resulting current response (delta_I(t) = I_0 * sin(omega * t + theta)). The frequency-dependent complex impedance is expressed as:
Z*(omega) = Z'(omega) - j * Z''(omega)
        -Z'' (Imaginary Impedance)
         ^
         |             *** High-Frequency
         |         *         * Bulk Arc (R_b || CPE_b)
         |       *             *
         |      *               *
         |     *                 *        *** Intermediate Arc
         |    *                   *    *       * (Phase Separation / Grain Boundary)
         |   *                     *  *         *
         |--*-----------------------*------------*---------------------------> Z' (Real)
            0                      R_b          R_total             Low-Frequency
                                                                    Electrode Spike
In a standard Nyquist plot (-Z'' versus Z'), an ideal ion-conducting glass equipped with electronically blocking electrodes produces two distinct spectral features:
- High-Frequency Semicircular Arc: Corresponds to bulk ionic conduction in parallel with the dielectric permittivity of the glass matrix. The high-frequency intercept with the real axis approaches the origin, while the low-frequency touch-down defines the true bulk resistance (R_bulk).
- Low-Frequency Inclined Spike: Arises from the capacitive accumulation of mobile ions at the blocking electrode interface (forming an electrical double layer, EDL).
Non-Ideal Depressed Arcs and Constant Phase Elements (CPE)
In disordered amorphous materials, the high-frequency impedance arc is rarely an ideal Debye semicircle centered on the real axis; instead, it exhibits a depressed center lying below the abscissa. This depression reflects a distribution of relaxation times originating from structural disorder, microscopic variations in hopping barrier heights, and distributed jump path geometries.
To accurately model this behavior, the ideal capacitor is replaced in the equivalent circuit by a Constant Phase Element (CPE, symbol Q), whose admittance is defined by:
Y_CPE(omega) = Q_0 * (j * omega)^n
Where Q_0 is a pseudo-capacitance parameter in units of S * s^n, and n is an empirical dispersion exponent (0 <= n <= 1). When n = 1, the element behaves as a pure lossless capacitor (Q_0 = C); when n = 0, it acts as an ideal resistor (Q_0 = 1 / R). For homogeneous glasses, n typically ranges between 0.85 and 0.98.
The true equivalent capacitance (C_eff) associated with a parallel R-CPE sub-circuit is extracted using the Brug or Ziewer-Brug formalisms:
C_eff = [R^(1 - n) * Q_0]^(1 / n)
The characteristic relaxation frequency (f_max = omega_max / (2 * pi)) at the zenith of the depressed semicircular arc satisfies:
omega_max = (R * Q_0)^(-1 / n)
Equivalent Circuit Modeling of Glass Electrolytes
The table below outlines the rigorous equivalent circuit topologies used to deconvolve complex transport mechanisms across different functional glass architectures.
| Microstructural Phase / Interface | Equivalent Circuit Element Topology | Characteristic Capacitance Range (C_eff) | Physical Relaxation Mechanism | Diagnostic Signature in Nyquist / Bode Plots |
|---|---|---|---|---|
| Bulk Glass Network | Parallel R_bulk | CPE_bulk | 1e-12 to 1e-11 F/cm (pico-farad range) | |
| Amorphous Phase Separation | Parallel R_inter | CPE_inter | 1e-10 to 1e-9 F/cm (sub-nanofarad range) | |
| Crystalline Grain Boundary | Parallel R_gb | CPE_gb | 1e-9 to 1e-8 F/cm (nanofarad range) | |
| Blocking Electrode Interface | Series CPE_electrode | 1e-6 to 1e-5 F/cm2 (microfarad range) | Mobile ion pileup at ionically blocking metallic contacts (Au, Pt) | Low-frequency capacitive tail; angle theta = n * 90 degrees (typically 60 to 80 deg) |
| Reversible Electrode Interface | Parallel R_ct | CPE_dl + Warburg (Z_W) | 1e-6 to 1e-4 F/cm2 |
From the deconvolved bulk resistance (R_bulk), the intrinsic DC ionic conductivity is calculated directly from the specimen geometry:
sigma_dc = (1 / R_bulk) * (d / A)
Where d is the polished thickness of the glass disc and A is the active electrode overlap area.
Blocking versus Non-Blocking (Reversible) Electrode Metrology
A frequent error in glass ionic characterization involves conflating blocking electrode polarization with charge-transfer impedance. The nature of the metal-glass contact dictates the low-frequency boundary conditions.
+---------------------------------------------------------------------------------------------------+
|                        Electrode Boundary Configurations for Glass EIS                            |
+---------------------------------------------------------------------------------------------------+
|  [Ionically Blocking Setup]                       [Reversible / Non-Blocking Setup]               |
|                                                                                                   |
|  +---------------------------+ Au/Pt Electrode    +---------------------------+ Li/Na Metal       |
|  |     Mobile Li+ Ions       |                    |     Mobile Li+ Ions       |               |
|  |  ==> ==> ==> ==> [Barrier]|                    |  ==> ==> ==> ==> [Reaction]| (Li+ + e- <-> Li)|
|  |     Solid Glass Matrix    |                    |     Solid Glass Matrix    |               |
|  +---------------------------+                    +---------------------------+                   |
|  Circuit: (R_b || CPE_b) + CPE_dl                 Circuit: (R_b || CPE_b) + (R_ct || CPE_dl) + Z_W
+---------------------------------------------------------------------------------------------------+
The table below contrasts the metrological attributes of these two electrode configurations.
| Metrological Parameter | Ionically Blocking Electrodes (Au, Pt, Al) | Reversible / Non-Blocking Electrodes (Li, Na, Ag) |
|---|---|---|
| Electrochemical Reaction | None; zero faradaic charge transfer across interface | Faradaic redox reaction (e.g., Li+ + e- <-> Li0) |
| Low-Frequency Impedance | Pure capacitive blocking; | Z |
| Primary Physical Target | Intrinsic bulk conductivity (sigma_bulk), dielectric relaxation | Total cell resistance (R_bulk + R_ct), critical stripping/plating current |
| Electrode Deposition Method | Sputtered thin-film gold (100–200 nm) or platinum paste | Direct thermal evaporation or mechanical pressing of active metal foil |
| Atmosphere Sensitivity | Moderate; ambient moisture must be excluded | Extreme; requires hermetic argon glovebox (<0.1 ppm O2, <0.1 ppm H2O) |
| Interfacial Stability | Thermodynamically stable; no dendrite or alloy formation | Susceptible to SEI interlayer growth, reduction, and dendrite shorting |
| Applicable Standards | ASTM C657, ISO 14868, JIS C2141 | ASTM C158, specialized solid-state battery testing protocols |
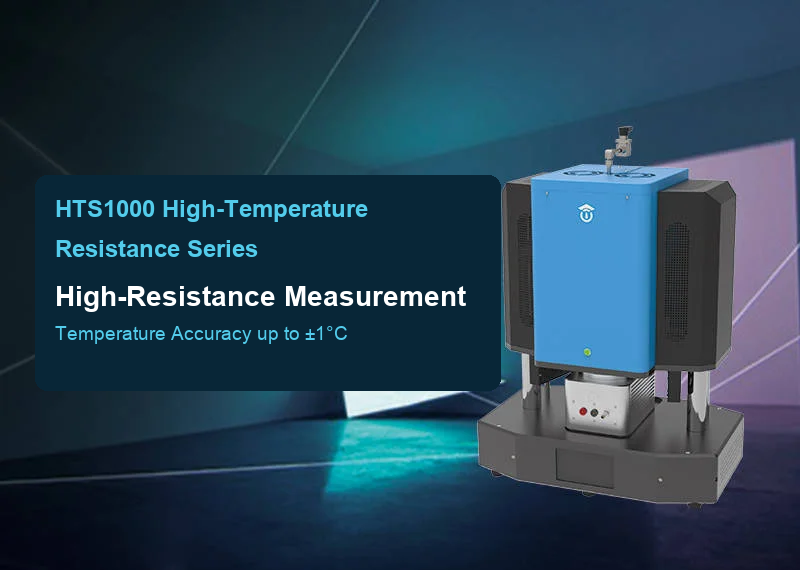
When evaluating bulk glass samples across broad thermal ranges, the MatMeas DMS-1000 High-Temperature Dielectric Spectrometer provides a fully shielded, sealable furnace environment. It supports controlled atmospheres (dry argon, nitrogen, vacuum, or air) and coplanar temperature sensing up to 1000 C, eliminating thermal lag during rapid Arrhenius sweeps.
Conversely, for solid-state battery electrolytes requiring deep sub-zero verification (such as lithium-ion freezing kinetics down to -160 C), the MatMeas DMS-2000 High-Low Temperature Dielectric Spectrometer integrates a vacuum-sealed cryostat with liquid nitrogen cooling, completely preventing ambient moisture condensation.
For testing ultra-thin electrolyte glass membranes, micro-batteries, or localized amorphous domains on silicon chips, the MatMeas CPS-7000 Cryogenic Vacuum Probe Station provides four-axis micro-manipulated probing with built-in pneumatic vibration damping, ensuring continuous contact stability without fracturing fragile glass substrates.
Experimental Artifacts, Stray Residuals, and De-Embedding Protocols
Achieving peer-reviewed precision in glass impedance metrology requires eliminating four primary sources of measurement distortion:
1. High-Resistance Voltage Divider and Cable Shunting
At low temperatures, high-purity silicate or phosphate glasses exhibit resistances exceeding 10^10 ohms. At these extreme impedances, the input impedance of standard measurement cables and instrument front-ends (typically 10 to 100 megaohms in parallel with 20 to 50 pF capacitance) forms a parasitic voltage divider, shunting the specimen:
Z_measured = Z_glass || Z_cable_stray
Failure to utilize active guarding or triaxial shielding results in massive artificial roll-offs in impedance, producing false low-temperature conductivity plateaus.
2. Electronic Conduction versus Ionic Conduction Deconvolution
Certain transition-metal-doped glasses (e.g., vanadate, iron phosphate, or titanium-doped glasses) exhibit mixed ionic-electronic conduction (MIEC). The total measured conductivity is the sum of ionic (sigma_ion) and electronic/polaron hopping (sigma_e) contributions:
sigma_total = sigma_ion + sigma_e
To separate these mechanisms:
- Hebb-Wagner DC Polarization: Apply a small constant DC voltage (typically 50 to 100 mV, below the decomposition voltage) across ionically blocking gold electrodes. The ionic current decays to zero as ions polarize, leaving only the steady-state electronic leakage current (I_e):
sigma_e = (I_e * d) / (V_applied * A)
The ionic transference number (t_ion) is then strictly quantified:
t_ion = sigma_ion / sigma_total = (sigma_total - sigma_e) / sigma_total
3. Warburg Impedance Modeling in Non-Blocking Cells
When using reversible electrodes, diffusion of active metal ions away from the interface introduces a semi-infinite Warburg impedance element (Z_W) at low frequencies:
Z_W(omega) = sigma_W * (1 - j) * omega^(-1/2)
Where sigma_W is the Warburg coefficient. Fitting the equivalent circuit without this element causes substantial overestimation of the bulk resistance.
Best-Practice Laboratory SOP for Glass Ionic Conductivity Testing
To produce defensible, audit-grade ionic transport data, adhere to the following experimental procedure:
- Sample Fabrication and Polishing: Cut glass specimens into circular discs with high parallel accuracy (<5 um taper across 15 mm diameter). Polish both faces to an optical finish using diamond suspensions down to 0.5 um to eliminate surface scratches that generate localized field enhancements.
- Thermal Annealing: Heat polished glass discs to T_g - 30 C in dry inert gas for 2 hours, then cool slowly at 1 C/min. This relaxes residual mechanical stresses induced during slicing and establishes a reproducible fictive temperature.
- Electrode Application:
- For blocking measurements: Sputter high-purity gold (200 nm thick) through a precision shadow mask to create an active circular electrode of precisely known area (e.g., 10.0 mm diameter).
- Ensure the outer rim remains uncoated (minimum 2.5 mm annular border) to eliminate surface creepage currents.
- Pre-Test Desorption: Load the specimen into the test fixture and hold at 120 C under vacuum (<1e-2 mbar) or dry nitrogen purge for 60 minutes to completely remove surface-adsorbed water layers.
- Impedance Measurement Protocol:
- Apply a small AC perturbation voltage (typically 10 mV to 50 mV RMS) to maintain the response within the strictly linear ohmic regime.
- Sweep frequency from 10 MHz down to 0.1 Hz, sampling at least 10 points per frequency decade.
- Execute temperature sweeps in steps of 10 C to 20 C, allowing a 15-minute thermal dwell at each plateau to ensure complete thermal equilibrium between the sample and the coplanar thermocouple.
- Data Fitting and Validation:
- Validate impedance spectra using the Kramers-Kronig (K-K) transformation to ensure the system satisfies causality, linearity, and time-invariance.
- Perform Complex Non-linear Least Squares (CNLS) fitting using an equivalent circuit containing at most one CPE per microstructural feature.
- Plot ln(sigma * T) versus 1000 / T, extracting the activation energy E_a from the linear slope.
Frequently Asked Questions (FAQ)
Why is sigma * T used in the Arrhenius equation instead of pure sigma?
The presence of the temperature factor T in the pre-exponential term originates directly from the Nernst-Einstein equation, which relates electrical mobility (mu) and conductivity (sigma = n * q * mu) to the diffusion coefficient (D = k_B * T * mu / q). Because hopping diffusion is an inherently Brownian, thermally agitated process, the absolute temperature explicitly enters the denominator of mobility. Plotting ln(sigma) versus 1/T instead of ln(sigma * T) introduces a systematic curvature in the Arrhenius plot, leading to erroneous activation energy calculations, particularly over wide temperature ranges (>200 K).
How can one verify that an impedance semicircle corresponds to bulk glass rather than grain boundaries?
In single-phase, homogeneous inorganic glasses, grain boundaries do not exist because the material lacks crystalline grains. The high-frequency arc will scale directly with the geometric ratio of the sample: doubling the thickness (d) while keeping the electrode area (A) constant will double the measured resistance while leaving the extracted capacitance (C_eff approx epsilon_0 * epsilon_r * A / d) consistent with a characteristic bulk dielectric permittivity (typically 5 to 20 pF/cm). If an intermediate-frequency semicircle is observed with an apparent capacitance in the nanofarad range (1e-9 F/cm), it indicates liquid-liquid phase separation, surface devitrification, or partial crystallization (glass-ceramic formation).
What causes a low-frequency tail to incline at an angle less than 90 degrees on blocking electrodes?
In ideal electrostatic theory, an ionically blocking electrode behaves as a pure capacitor, producing a vertical 90-degree line in the Nyquist plot. In real glass experiments, this tail inclines at an angle theta = n * 90 degrees, typically between 65 and 80 degrees. This non-ideal behavior arises from atomic-scale electrode surface roughness, non-uniform current distribution across the contact periphery, dynamic adsorption-desorption kinetics of mobile ions, and microscopic chemical heterogeneity at the glass-metal interface. Modeling this tail with a Constant Phase Element (CPE_dl) accurately captures this distributed double-layer phenomenon.
Related Instruments & Equipment
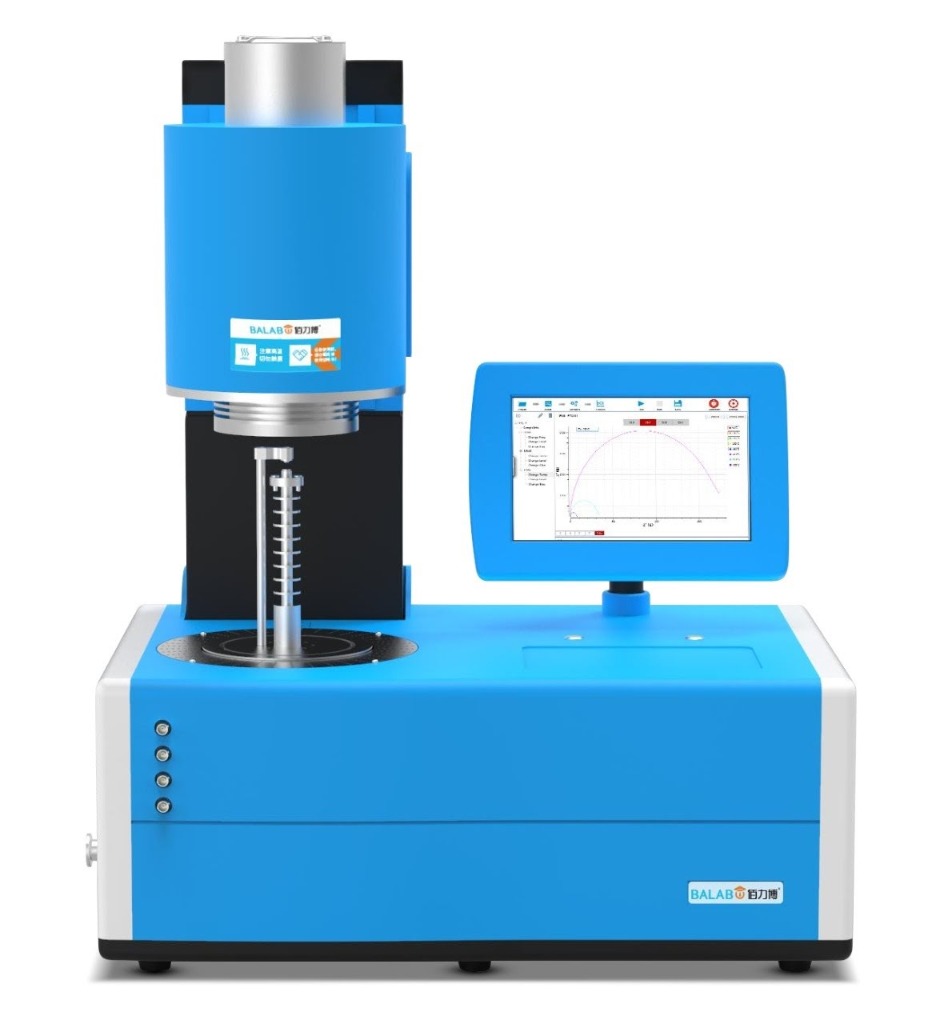
MatMeas DMS1000 High-Temperature Dielectric Spectrometer
The MatMeas DMS1000 is an advanced High-Temperature Dielectric Impedance Temperature Spectrometer engineered for the ultimate electrical characterization of bulk materials. Delivering an exceptional measurement accuracy of 0.05%, it operates efficiently from Room Temperature (RT) to 1000°C. Its upgraded platform supports both single-sample and four-sample simultaneous measurements. Integrated with a sealable metal shielding system and high-purity platinum electrodes, the DMS1000 enables highly reliable testing across inert, oxidizing, reducing, and vacuum atmospheres, making it an indispensable infrastructure for precision materials science.
View details →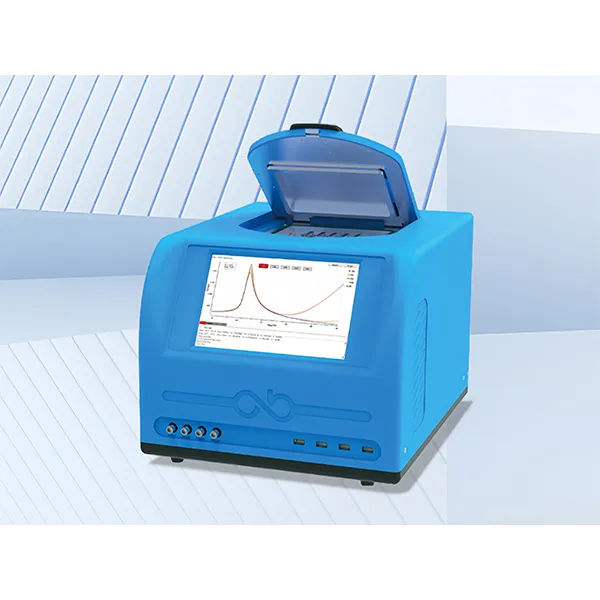
MatMeas DMS2000 High-Low Temperature Dielectric Spectrometer
The MatMeas DMS2000 is an advanced High and Low Temperature Dielectric Impedance Spectrometer engineered for evaluating the dielectric properties of materials under extreme thermal conditions. Compliant with the ASTM D150 standard, it integrates a proprietary LNP-95 liquid nitrogen injection system to achieve seamless continuous temperature variation from -160°C to 450°C. Uniquely featuring a vacuum-enabled sample chamber to completely prevent thermal frosting and eliminate false water peaks near 0°C, along with versatile options for single-sample or five-sample simultaneous testing, the DMS2000 ensures unparalleled data fidelity and high throughput for advanced scientific research.
View details →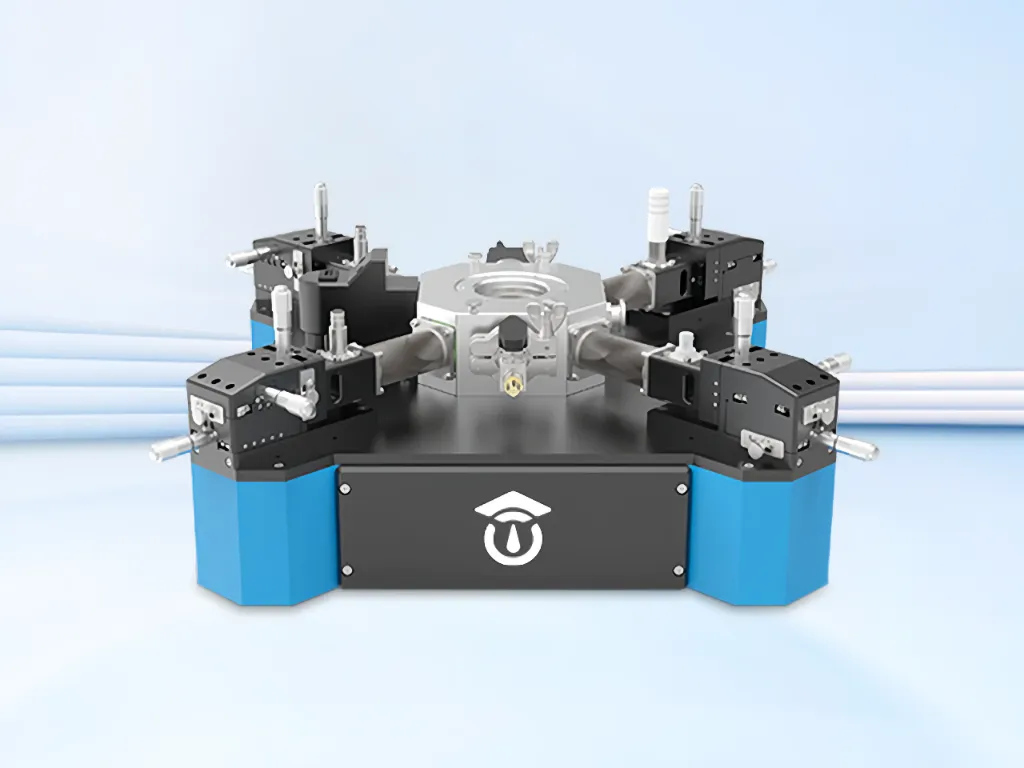
CPS7000 High-Low Temperature Dielectric Vacuum Probe Station
The MatMeas CPS7000 is an advanced, highly integrated desktop High-Low Temperature Dielectric Vacuum Probe Station engineered for the rigorous electrical characterization of thin films, bulk materials, and semiconductor wafers. Delivering performance directly comparable to industry-leading American brands like Lake Shore and Janis, this compact platform offers an ultra-wide temperature range from -160°C to 450°C via liquid nitrogen cooling. Uniquely equipped with a proprietary built-in air shock anti-vibration system, the CPS7000 eliminates data jumping points during continuous temperature variations. Supporting complex high-voltage and low-current testing environments, it is the ultimate infrastructure for evaluating dielectric, piezoelectric, ferroelectric, and TSDC properties in high-vacuum conditions.
View details →Request High-Precision Testing Solutions
Get expert guidance and customized instruments for your functional materials project.