Dielectric Testing: Curie Temperature, Nyquist, and Cole-Cole Plots
Technical News

Dielectric spectroscopy serves as the primary analytical window into the microscopic charge dynamics, defect structures, and phase transformation kinetics of solid-state electroceramics, ferroelectrics, and solid electrolytes. When an alternating electric field interrogates a condensed-matter dielectric, electrical displacement reflects a superposition of intrinsic lattice polarization, localized dipolar reorientation, space-charge carrier accumulation, and long-range ionic conduction.
Disentangling these overlapping electrical mechanisms requires multi-dimensional analytical representations across both frequency (sub-hertz to gigahertz) and temperature (-160°C to 1000°C). Three mathematical representations form the core of solid-state dielectric metrology: Curie temperature (Tc) thermal profiling, Nyquist complex impedance spectroscopy, and Cole-Cole complex permittivity modeling. In accordance with ASTM D150 and IEC 60250 protocols, combining these three analytical frameworks enables materials scientists to decouple bulk grain transport from grain-boundary barriers, pinpoint structural phase transformations, and model dipolar relaxation kinetics with absolute physical rigor.
Curie Temperature (Tc): Thermally Driven Structural Transitions
In ferroelectric and piezoelectric electroceramics (such as BaTiO3, PZT, and KNN solid solutions), the Curie temperature represents the critical thermodynamic boundary separating a non-centrosymmetric ferroelectric phase from a centrosymmetric paraelectric phase:
- Below Tc: The crystal lattice exhibits spontaneous polarization (
P_s != 0). Switchable ferroelectric domains impart macroscopic piezoelectric, pyroelectric, and non-linear electro-optic capabilities. - Above Tc: Thermal kinetic energy exceeds the structural distortion energy, driving a phase transition to a cubic or centrosymmetric lattice. Spontaneous polarization vanishes (
P_s = 0), and all piezoelectric activity is permanently lost.
As temperature approaches Tc during thermal sweeps, the material undergoes extreme dielectric softening. The real relative permittivity (ε') surges to a sharp peak before decaying in the paraelectric regime in accordance with the classic Curie-Weiss Law:
ε_r = C / ( T - T_0 ) (for T > Tc)
where C is the Curie-Weiss constant (typically 10^5 K in perovskite ferroelectrics), T is absolute temperature in Kelvin, and T_0 is the Curie-Weiss temperature (equal to or slightly below Tc depending on whether the transition is second-order or first-order).
Accurately resolving Tc dictates the thermal ceiling for multi-layer ceramic capacitors (MLCCs), high-temperature transducers, and aerospace sensors. However, measuring Tc requires ultra-precise thermal equilibrium: thermal gradients between the sample and thermocouple introduce false peak shifts, while air gaps in rigid sample fixtures introduce parasitic series capacitances that depress apparent permittivity values. Modern characterization platforms like the High-Temperature Dielectric Impedance Spectrometer (DTS-1000) eliminate these artifacts by deploying coplanar temperature sensors directly on the sample surface and spring-loaded self-weight platinum electrodes (contact force ≤0.25 N), resolving sharp dielectric permittivity peaks up to 1000°C without risk of chipping brittle electroceramics.
Nyquist Plots: Decoupling Microstructural Impedance via Brick-Layer Modeling
While thermal profiling tracks macroscopic phase boundaries, complex impedance spectroscopy plotted on a Nyquist diagram maps the spatial and microstructural electrical inhomogeneity of polycrystalline materials.
A Nyquist plot presents the real component of impedance (Z') along the horizontal axis and the negative imaginary component (-Z'') along the vertical axis across swept frequencies:
Z*(ω) = Z' - i * Z''
In polycrystalline electroceramics and solid-state battery electrolytes, electrical transport is partitioned between crystalline grains and intergranular grain boundaries. In accordance with the classical Brick-Layer Model, the ceramic is represented as an equivalent electrical network of parallel resistor-capacitor (R-C) or resistor-constant phase element (R-CPE) sub-circuits connected in series:
Z*(ω) = [ R_g / ( 1 + i * ω * R_g * C_g ) ] + [ R_gb / ( 1 + i * ω * R_gb * C_gb ) ] + Z_electrode
Equivalent Circuit (Brick-Layer Model):
  ┌───────── Rg ─────────┐     ┌───────── Rgb ────────┐
──┤                      ├──-──┤                      ├──-──[ Electrode ]──
  └───────── Cg ─────────┘     └───────── Cgb ────────┘
     (Bulk Grain Core)           (Grain Boundary Shell)
In a pristine Nyquist plot, this network manifests as sequential semicircles evolving from high to low frequencies:
- High-Frequency Semicircle (Bulk Grain Core, Rg, Cg): Reflects rapid intra-grain electronic and polar lattice displacement. The diameter along the real Z' axis corresponds to the bulk grain resistance
R_g, with typical capacitance valuesC_granging from 10^-12 F to 10^-11 F (dielectric permittivity εr ≈ 10 to 1,000). The semicircle apex satisfiesω * R_g * C_g = 1. - Intermediate-Frequency Semicircle (Grain Boundary Shell, Rgb, Cgb): Reflects trapped charge accumulation and potential energy barriers across intergranular regions. The diameter corresponds to grain boundary resistance
R_gb. Because grain boundaries are thin (1 to 5 nm) relative to grain dimensions, their effective capacitanceC_gbis much larger (10^-9 F to 10^-8 F), shifting their characteristic relaxation frequency to lower decades (ω_gb << ω_g). - Low-Frequency Tail or Semicircle (Electrode Interface): In ionic conductors and solid electrolytes (such as LLZO), mobile lithium or oxygen ions block at metallic electrodes, generating double-layer capacitance (
C_dl~ 10^-6 F) that appears as a steep low-frequency spur.
Decoupling R_g from R_gb via complex non-linear least squares (CNLS) fitting allows materials engineers to diagnose whether high total resistance originates from pristine grain stoichiometry or resistive boundary phases, guiding sintering optimization.
Cole-Cole Plots: Quantifying Dielectric Dispersion and Non-Debye Relaxation
While Nyquist plots emphasize resistive transport, the Cole-Cole plot maps complex relative permittivity, presenting real permittivity (ε') on the horizontal axis against dielectric loss (ε'') on the vertical axis:
ε*(ω) = ε' - i * ε''
In an idealized system containing identical, non-interacting dipoles, dielectric relaxation follows the single-relaxation-time Debye Model:
ε*(ω) = ε_inf + ( ε_s - ε_inf ) / ( 1 + i * ω * τ )
where ε_s is the static (low-frequency) permittivity, ε_inf is the optical (infinite-frequency) permittivity, ω is angular frequency, and τ is the macroscopic relaxation time constant. In the complex plane (ε'' versus ε'), the Debye model traces a perfect semicircle centered directly on the real horizontal axis.
In real functional materials, microscopic structural disorder, grain boundary variations, and defect-dipole interactions produce a broad distribution of relaxation times. K. S. Cole and R. H. Cole generalized this behavior into the definitive Cole-Cole Relaxation Equation:
ε*(ω) = ε_inf + ( ε_s - ε_inf ) / [ 1 + ( i * ω * τ )^(1 - α) ]
where α is the empirical distribution parameter (0 ≤ α < 1):
- When
α = 0, the equation collapses to the ideal single-time-constant Debye relaxation. - When
α > 0, the relaxation times are distributed over a finite spectral width. In the complex plane, the center of the semicircle is depressed below the real horizontal axis by an angle ofθ = α * π / 2.
Extracting α quantifies the degree of disorder and defect clustering within the dielectric matrix, providing an empirical metric for evaluating doping homogeneity and carrier localization in high-frequency telecommunications ceramics.
| Formalism | Coordinate Axis Presentation | Dominant Physical Phenomenon Resolved | Microstructural Element Mapping | High-Frequency Intercept | Low-Frequency DC Conduction Sensitivity |
|---|---|---|---|---|---|
| Nyquist Impedance (Z)* | Horizontal: Z' (Real) / Vertical: -Z'' (Imaginary) | Resistive transport pathways; ionic conduction barriers | Semicircle 1: Bulk Grain (Rg) / Semicircle 2: Grain Boundary (Rgb) | Z' -> 0 (Lead resistance) | Low; DC conduction manifests as real-axis intercept |
| Cole-Cole Permittivity (ε)* | Horizontal: ε' (Real) / Vertical: ε'' (Loss) | Dipolar relaxation dispersion; polarization kinetics | Depressed arc center: Relaxation distribution parameter α | ε' -> ε_inf (Optical electronic limit) | Extreme; DC conduction causes ε'' to surge as σ_dc / (ω*ε_0) |
| Electric Modulus (M)* | Horizontal: M' (Real) / Vertical: M'' (Imaginary) | Space-charge relaxation; electrode polarization suppression | Emphasizes smallest capacitances (bulk grain phenomena) | M' -> 1 / ε_inf | Completely eliminates DC conduction electrode artifacts |
| Material Formulation | Primary Crystal Symmetry | Curie Temp Tc (°C) | Static Permittivity ε_s (@ 1 kHz) | Optical Permittivity ε_inf | Cole-Cole Parameter α | Bulk Grain Resistance Rg @ 300°C (Ω·cm) | Grain Boundary Resistance Rgb @ 300°C (Ω·cm) |
|---|---|---|---|---|---|---|---|
| Barium Titanate (BaTiO3) | Tetragonal Perovskite (P4mm) | 125 - 130 | 1,800 - 2,500 | 5.5 - 6.2 | 0.08 - 0.15 | 2.5 * 10^5 | 8.0 * 10^7 |
| PZT-5H Piezoelectric | Morphotropic Perovskite | 190 - 195 | 3,200 - 3,600 | 7.0 - 8.0 | 0.12 - 0.22 | 1.2 * 10^5 | 4.5 * 10^6 |
| LLZO Solid Electrolyte | Cubic Garnet (Ia-3d) | No Tc (Ionic conductor) | 45 - 65 | 4.8 - 5.2 | 0.25 - 0.35 | 1.8 * 10^2 | 8.5 * 10^2 |
| Lead-Free KNN Ceramic | Orthorhombic Perovskite | 410 - 420 | 1,100 - 1,400 | 5.8 - 6.5 | 0.10 - 0.18 | 4.0 * 10^4 | 1.5 * 10^6 |
| 96% Al2O3 Substrate | Hexagonal Corundum (R-3c) | No Tc (Paraelectric) | 9.2 - 9.8 | 3.1 - 3.4 | 0.02 - 0.06 | 3.0 * 10^11 | 1.2 * 10^10 |
Elimination of Measurement Artifacts: Air Gaps and Fringing Fields
Executing high-temperature dielectric spectroscopy up to 1000°C introduces severe experimental pitfalls that frequently corrupt Nyquist and Cole-Cole plots:
- Parasitic Air-Gap Capacitance: Polycrystalline ceramic surfaces possess microscopic roughness. When clamped between rigid metallic test electrodes, microscopic air gaps remain trapped at the interface. Because the dielectric permittivity of air is 1.0, this tiny air gap acts as an ultra-low capacitor in series with the ceramic:
C_measured = ( C_sample * C_gap ) / ( C_sample + C_gap )In high-permittivity materials (εr > 1,000), even a 1-micrometer air gap depresses the apparent dielectric constant by more than 50% to 80%. - Fringing Field Bloating: At sample perimeters, electric field lines curve outside the physical electrode diameter. Without active guard rings, fringing field capacitance bloats measured permittivity and distorts the circularity of Cole-Cole arcs.
These geometric errors are eliminated by mounting specimens inside specialized conforming fixtures, such as the MatMeas TSC-6520 variable-temperature solid dielectric test fixture. Operating from ambient to 1000°C, the TSC-6520 utilizes dynamically compliant, spring-loaded platinum contacts that automatically adjust to thermal expansion and surface irregularities, maintaining constant contact pressure throughout multi-hour thermal sweeps. Furthermore, its precision-machined concentric guard ring shunts peripheral fringing fields directly to system ground, forcing internal field lines to remain strictly parallel through the specimen.
For comprehensive broad-temperature investigations, the fixture interfaces seamlessly with dedicated spectrometer platforms. Engineered specifically for functional ceramics and high-temperature phase-boundary mapping, the MatMeas DTS-1000 High-Temperature Dielectric Impedance Spectrometer spans from room temperature up to 1000°C over 1 Hz to 10 MHz. Its coplanar thermocouple sensing and automated Cole-Cole/Nyquist plotting capabilities deliver reproducible complex impedance deconvolution and Tc transition profiling. For general-purpose wideband dielectric spectroscopy, the MatMeas DMS-1000 high-temperature dielectric spectrometer provides ultra-stable, closed-loop PID thermal control up to 1000°C, making it the benchmark platform for capturing high-temperature oxygen vacancy relaxations and phase transitions. To explore sub-zero relaxation kinetics and cryogenic glass transitions without atmospheric moisture condensation, the MatMeas DMS-2000 high-low temperature spectrometer integrates a vacuum-enabled chamber (< 10^-1 Pa) and controlled liquid nitrogen cooling down to -160°C, delivering pristine wideband dielectric spectra across nine frequency decades.
FAQ
Q: How does a Nyquist plot distinguish between grain and grain-boundary resistance?
A: In a polycrystalline ceramic, bulk grains and grain boundaries possess vastly different electrical capacitance values. The bulk grain capacitance (Cg) is small (typically picofarads), while the thin grain-boundary barrier layer yields a much larger capacitance (Cgb, typically nanofarads). Because the characteristic relaxation frequency of a parallel R-C network is ω = 1 / (R * C), the grain core responds at much higher frequencies than the grain boundary. On a Nyquist plot, this frequency separation splits the response into two distinct semicircles: the high-frequency semicircle reveals pure bulk grain resistance (Rg), while the lower-frequency semicircle isolates grain-boundary resistance (Rgb).
Q: What does a depressed Cole-Cole semicircle indicate about a dielectric material?
A: An ideal Debye relaxation traces a perfect semicircle with its center located directly on the horizontal real axis (α = 0), representing a single, uniform dipole relaxation time constant. In physical ceramics, microstructural defects, compositional fluctuations, and local strain variations cause different dipoles to experience different local energy barriers. This produces a distribution of relaxation times, which depresses the center of the Cole-Cole semicircle below the horizontal axis by an angle of θ = α * π / 2. A larger distribution parameter α indicates greater microscopic disorder within the material.
Q: Why does DC electrical conductivity cause Cole-Cole plots to shoot upward at low frequencies?
A: In complex permittivity modeling, the total imaginary permittivity is ε''_total = ε''_dipolar + [ σ_dc / ( ω * ε_0 ) ], where σ_dc is the material's direct-current electrical conductivity. At high frequencies, the dipolar loss term dominates. However, as frequency (ω) decreases toward zero, the conduction term σ_dc / (ω * ε_0) surges toward infinity. In high-temperature or leaky dielectric specimens, this causes the low-frequency tail of the Cole-Cole plot to shoot straight upward, masking the completion of the relaxation semicircle unless mathematically subtracted.
Related Instruments & Equipment
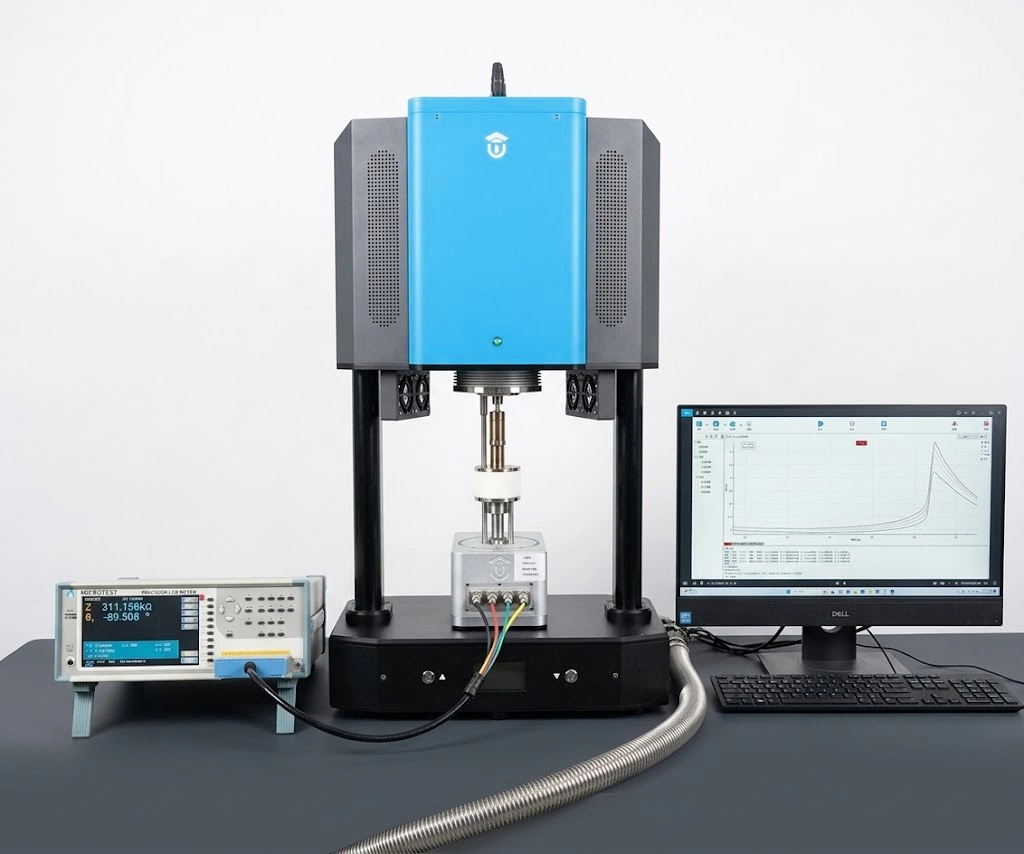
MatMeas DTS1000 High-Temperature Dielectric Impedance Spectrometer
Built on the proven DMS series platform, the MatMeas DTS1000 is a next-generation high-temperature dielectric impedance spectrometer engineered specifically for high-temperature mechanistic research on functional ceramics and advanced dielectric materials. Its modular architecture supports effortless plug-and-play switching between single-channel precision measurement and four-channel high-throughput screening. Across a wide temperature range from room temperature to 1000°C, the DTS1000 delivers fully automated, high-accuracy mapping of dielectric constant, dielectric loss, Curie temperature, and Cole-Cole/Nyquist spectra.
View details →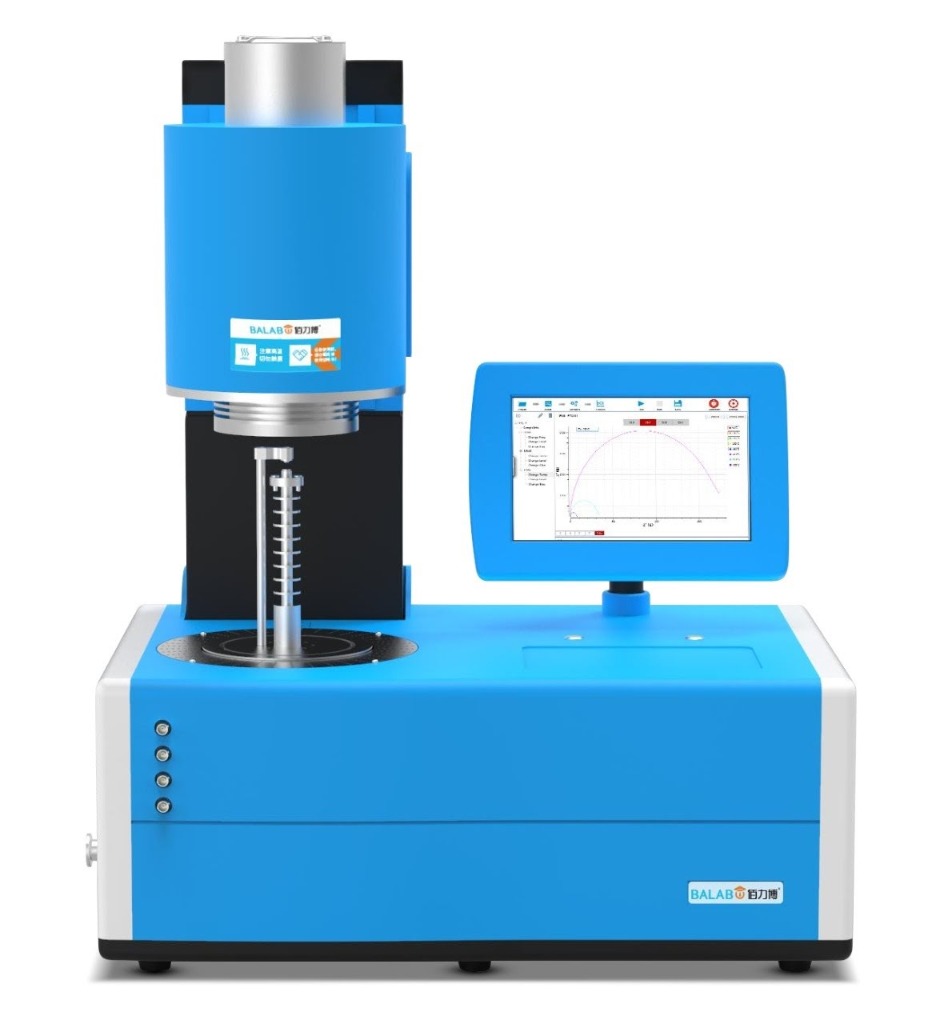
MatMeas DMS1000 High-Temperature Dielectric Spectrometer
The MatMeas DMS1000 is an advanced High-Temperature Dielectric Impedance Temperature Spectrometer engineered for the ultimate electrical characterization of bulk materials. Delivering an exceptional measurement accuracy of 0.05%, it operates efficiently from Room Temperature (RT) to 1000°C. Its upgraded platform supports both single-sample and four-sample simultaneous measurements. Integrated with a sealable metal shielding system and high-purity platinum electrodes, the DMS1000 enables highly reliable testing across inert, oxidizing, reducing, and vacuum atmospheres, making it an indispensable infrastructure for precision materials science.
View details →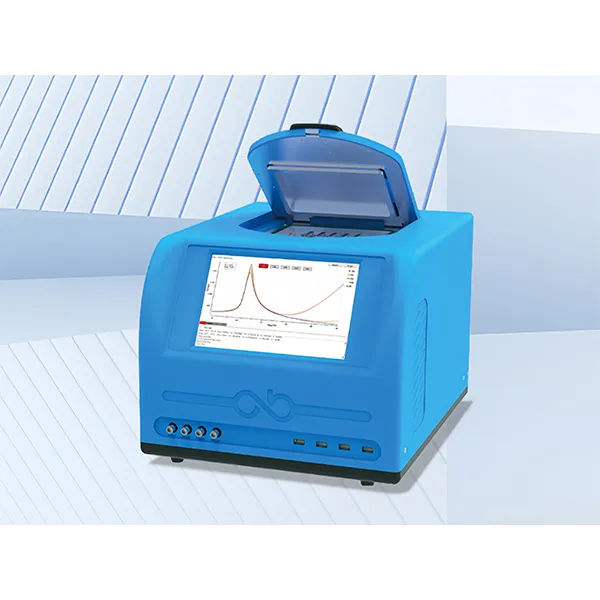
MatMeas DMS2000 High-Low Temperature Dielectric Spectrometer
The MatMeas DMS2000 is an advanced High and Low Temperature Dielectric Impedance Spectrometer engineered for evaluating the dielectric properties of materials under extreme thermal conditions. Compliant with the ASTM D150 standard, it integrates a proprietary LNP-95 liquid nitrogen injection system to achieve seamless continuous temperature variation from -160°C to 450°C. Uniquely featuring a vacuum-enabled sample chamber to completely prevent thermal frosting and eliminate false water peaks near 0°C, along with versatile options for single-sample or five-sample simultaneous testing, the DMS2000 ensures unparalleled data fidelity and high throughput for advanced scientific research.
View details →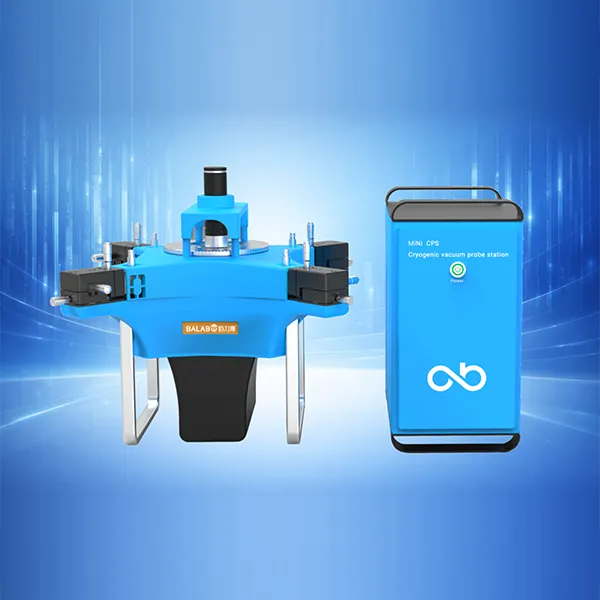
MatMeas TSC-6520 Variable Temperature Solid Dielectric Test Fixture
High-precision variable temperature solid dielectric test fixture designed for accurate measurement of dielectric constant, loss, and impedance of solid materials over a wide temperature range.
View details →Request High-Precision Testing Solutions
Get expert guidance and customized instruments for your functional materials project.